
50-Year Performance: Gold vs. the S&P 500 (1975-2025)
The Nixon administration ended gold’s fixed $35/oz peg to the dollar in August 1971. By January 1975, Americans could legally own gold for investment purposes again. That makes 1975 a natural starting point for a fair 50-year comparison.
Here is what the data shows across five decades.
Nominal returns look closer than they are. Stocks generate dividends that compound over time. Gold generates no income: its return is purely price appreciation. When you reinvest S&P 500 dividends, the gap widens significantly. S&P Dow Jones Indices data shows the S&P 500 Total Return Index compounding at roughly 10-11% annually from 1975-2025 versus gold’s spot price appreciation of roughly 7-8% over the same period.
In real (inflation-adjusted) terms, the gap is starker. The World Gold Council’s long-run analysis places gold’s real return at approximately 3-4% annually over this horizon. Equities have historically delivered roughly 7% in real terms (Ibbotson Associates, now Morningstar, historical return data).
Decade-by-Decade Breakdown
| Decade | Gold approx. nominal return | S&P 500 approx. total return | Winner |
|---|---|---|---|
| 1975-1979 | +130% (oil shocks, inflation) | +82% | Gold |
| 1980-1989 | -26% (post-peak crash) | +403% | Stocks |
| 1990-1999 | -28% (tech boom, gold ignored) | +430% | Stocks |
| 2000-2009 | +281% (two bear markets) | -9% (two recessions) | Gold |
| 2010-2019 | -7% to +7% (range) | +253% | Stocks |
| 2020-2025 | +65% (COVID spike + 2024-25 run) | +85% (COVID recovery + bull run) | Near tie |
The pattern is clear: stocks win in most decades. Gold wins decisively in the two periods when equities suffered the deepest and most prolonged losses (the inflationary 1970s and the “lost decade” of 2000-2009). This decade breakdown is the single most important data set to understand before making any gold IRA allocation decision.


Over 50 years, a $10,000 investment in the S&P 500 Total Return (1975-2025) grew to roughly $1.7 million. The same $10,000 in gold grew to roughly $300,000-$350,000. Both figures are before taxes, fees, and inflation. The ratio matters: equities compounded approximately 5x more than gold over this period.
Why Stocks Have Outperformed Gold Over the Long Run
Three structural reasons explain why stocks generate higher long-run returns than gold.
1. Productive capital. When you own stock, you own a share of a business that employs workers, develops products, and generates profit. That profit can be returned to shareholders as dividends or reinvested to grow the business. Gold produces nothing. It sits in a vault. Its price depends entirely on what someone else will pay for it.
2. Dividends compound. The S&P 500’s long-run nominal return of roughly 10-11% includes reinvested dividends, which have historically contributed approximately 4 percentage points annually. Gold has no equivalent income stream. An investor comparing the two must account for this compounding effect, which becomes enormous over multi-decade time horizons.
3. Economic growth lifts equity values. As an economy grows, corporate revenues and earnings generally grow with it. The equity market reflects this expansion over time. Gold’s price is decoupled from economic growth. It responds to different variables: real interest rates, currency weakness, geopolitical stress, and investor sentiment toward risk assets.
The FINRA Investor Education Foundation notes that investors who understand the asset class differences between equities and commodities are better positioned to set realistic return expectations. Gold is a commodity, not a productive asset. Treating it as an equity substitute leads to unrealistic return assumptions.
When Gold Has Outperformed: Crisis Periods and Bear Markets
Gold’s long-run underperformance relative to stocks obscures something important: gold does not move in sync with equities. In specific high-stress periods, gold has delivered strong gains while stocks fell sharply.


| Crisis Period | S&P 500 Return | Gold Return | Gold’s Role |
|---|---|---|---|
| 2000-2002 Dot-com bust | -49% | +12% | Positive offset |
| 2007-2009 Financial crisis | -55% | +24% | Significant offset |
| 2020 COVID crash (Q1) | -34% | +5% | Mild offset (gold dipped initially, recovered fast) |
| 2022 Rate hike bear market | -19% | -0.3% (near flat) | Flat (no major offset) |
The 2007-2009 crisis is the most instructive. While the S&P 500 lost over half its value peak to trough, gold gained 24%. A portfolio that held 10% gold and 90% equities did not lose 55%. The gold allocation acted as a partial buffer. China and Russia’s sustained central bank buying adds a geopolitical demand driver the gold IRA geopolitical risk guide covers for 2026.
The 2022 environment shows gold’s limits. Rising real interest rates are generally negative for gold (holding gold has an opportunity cost when bonds yield more). In rate-rising environments, gold’s buffering effect is less reliable.
For someone in or near retirement, a 35-55% market decline is not a statistical abstraction. It directly reduces the pool of assets from which withdrawals are made. If those withdrawals happen during a sustained drawdown, the sequencing of returns can permanently impair a retirement portfolio. A gold allocation that holds steady during an equity selloff reduces the severity of that drawdown scenario. This is the core practical argument for gold in a retirement context.
The Correlation Argument: Gold as a Portfolio Stabilizer
Return performance tells only part of the story. What matters for portfolio construction is the correlation between assets: how closely they move together.
Research consistently shows gold has a low or negative correlation with the S&P 500 over market cycles. World Gold Council data covering 1971-2025 places the average rolling 10-year correlation between gold and the S&P 500 at approximately -0.1 to +0.2. In plain terms: gold and stocks do not move together reliably. In crisis periods, they often move in opposite directions.
This is why the portfolio construction argument for gold is separate from the return argument. You do not hold gold because you expect it to outperform stocks. You hold it because it tends not to fall when stocks fall, which means your combined portfolio falls less than an all-equity portfolio during market stress.
Modern portfolio theory (Markowitz, 1952) demonstrated mathematically that combining assets with low or negative correlation reduces portfolio volatility without a proportional reduction in expected return. Gold’s low correlation with equities makes it a theoretically valid portfolio diversifier regardless of whether it outperforms on an absolute return basis. The choice between physical gold vs mining stocks changes that correlation profile significantly, since miners track equities more closely than bullion does.
Portfolio Allocation Research: The 5-10% Gold Rule
How much gold should a diversified retirement portfolio hold, if any? Academic research and institutional analysis provide a reasonably consistent answer.
The Ibbotson Associates study (published by the World Gold Council), which analyzed portfolio performance from 1973-2004, found that allocations between 5-10% gold optimized the risk-adjusted return of a diversified portfolio. Below 5%, the diversification benefit was minimal. Above 15-20%, the return drag from gold’s lower absolute return began to outweigh the volatility reduction benefit.
More recent analysis from the World Gold Council’s “Gold as a Strategic Asset” research series (updated through 2024) reaches similar conclusions. For a U.S.-based investor holding a portfolio of 60% equities and 40% bonds, adding a 5-10% gold allocation has historically reduced maximum drawdown by 2-5 percentage points while reducing expected annual return by less than 0.5 percentage points.
The practical takeaway: a 5-10% gold allocation in a retirement portfolio has historically been a reasonable way to reduce worst-case downside without materially sacrificing compounded long-run growth. This is not a guarantee for future periods. It is what the historical data shows.
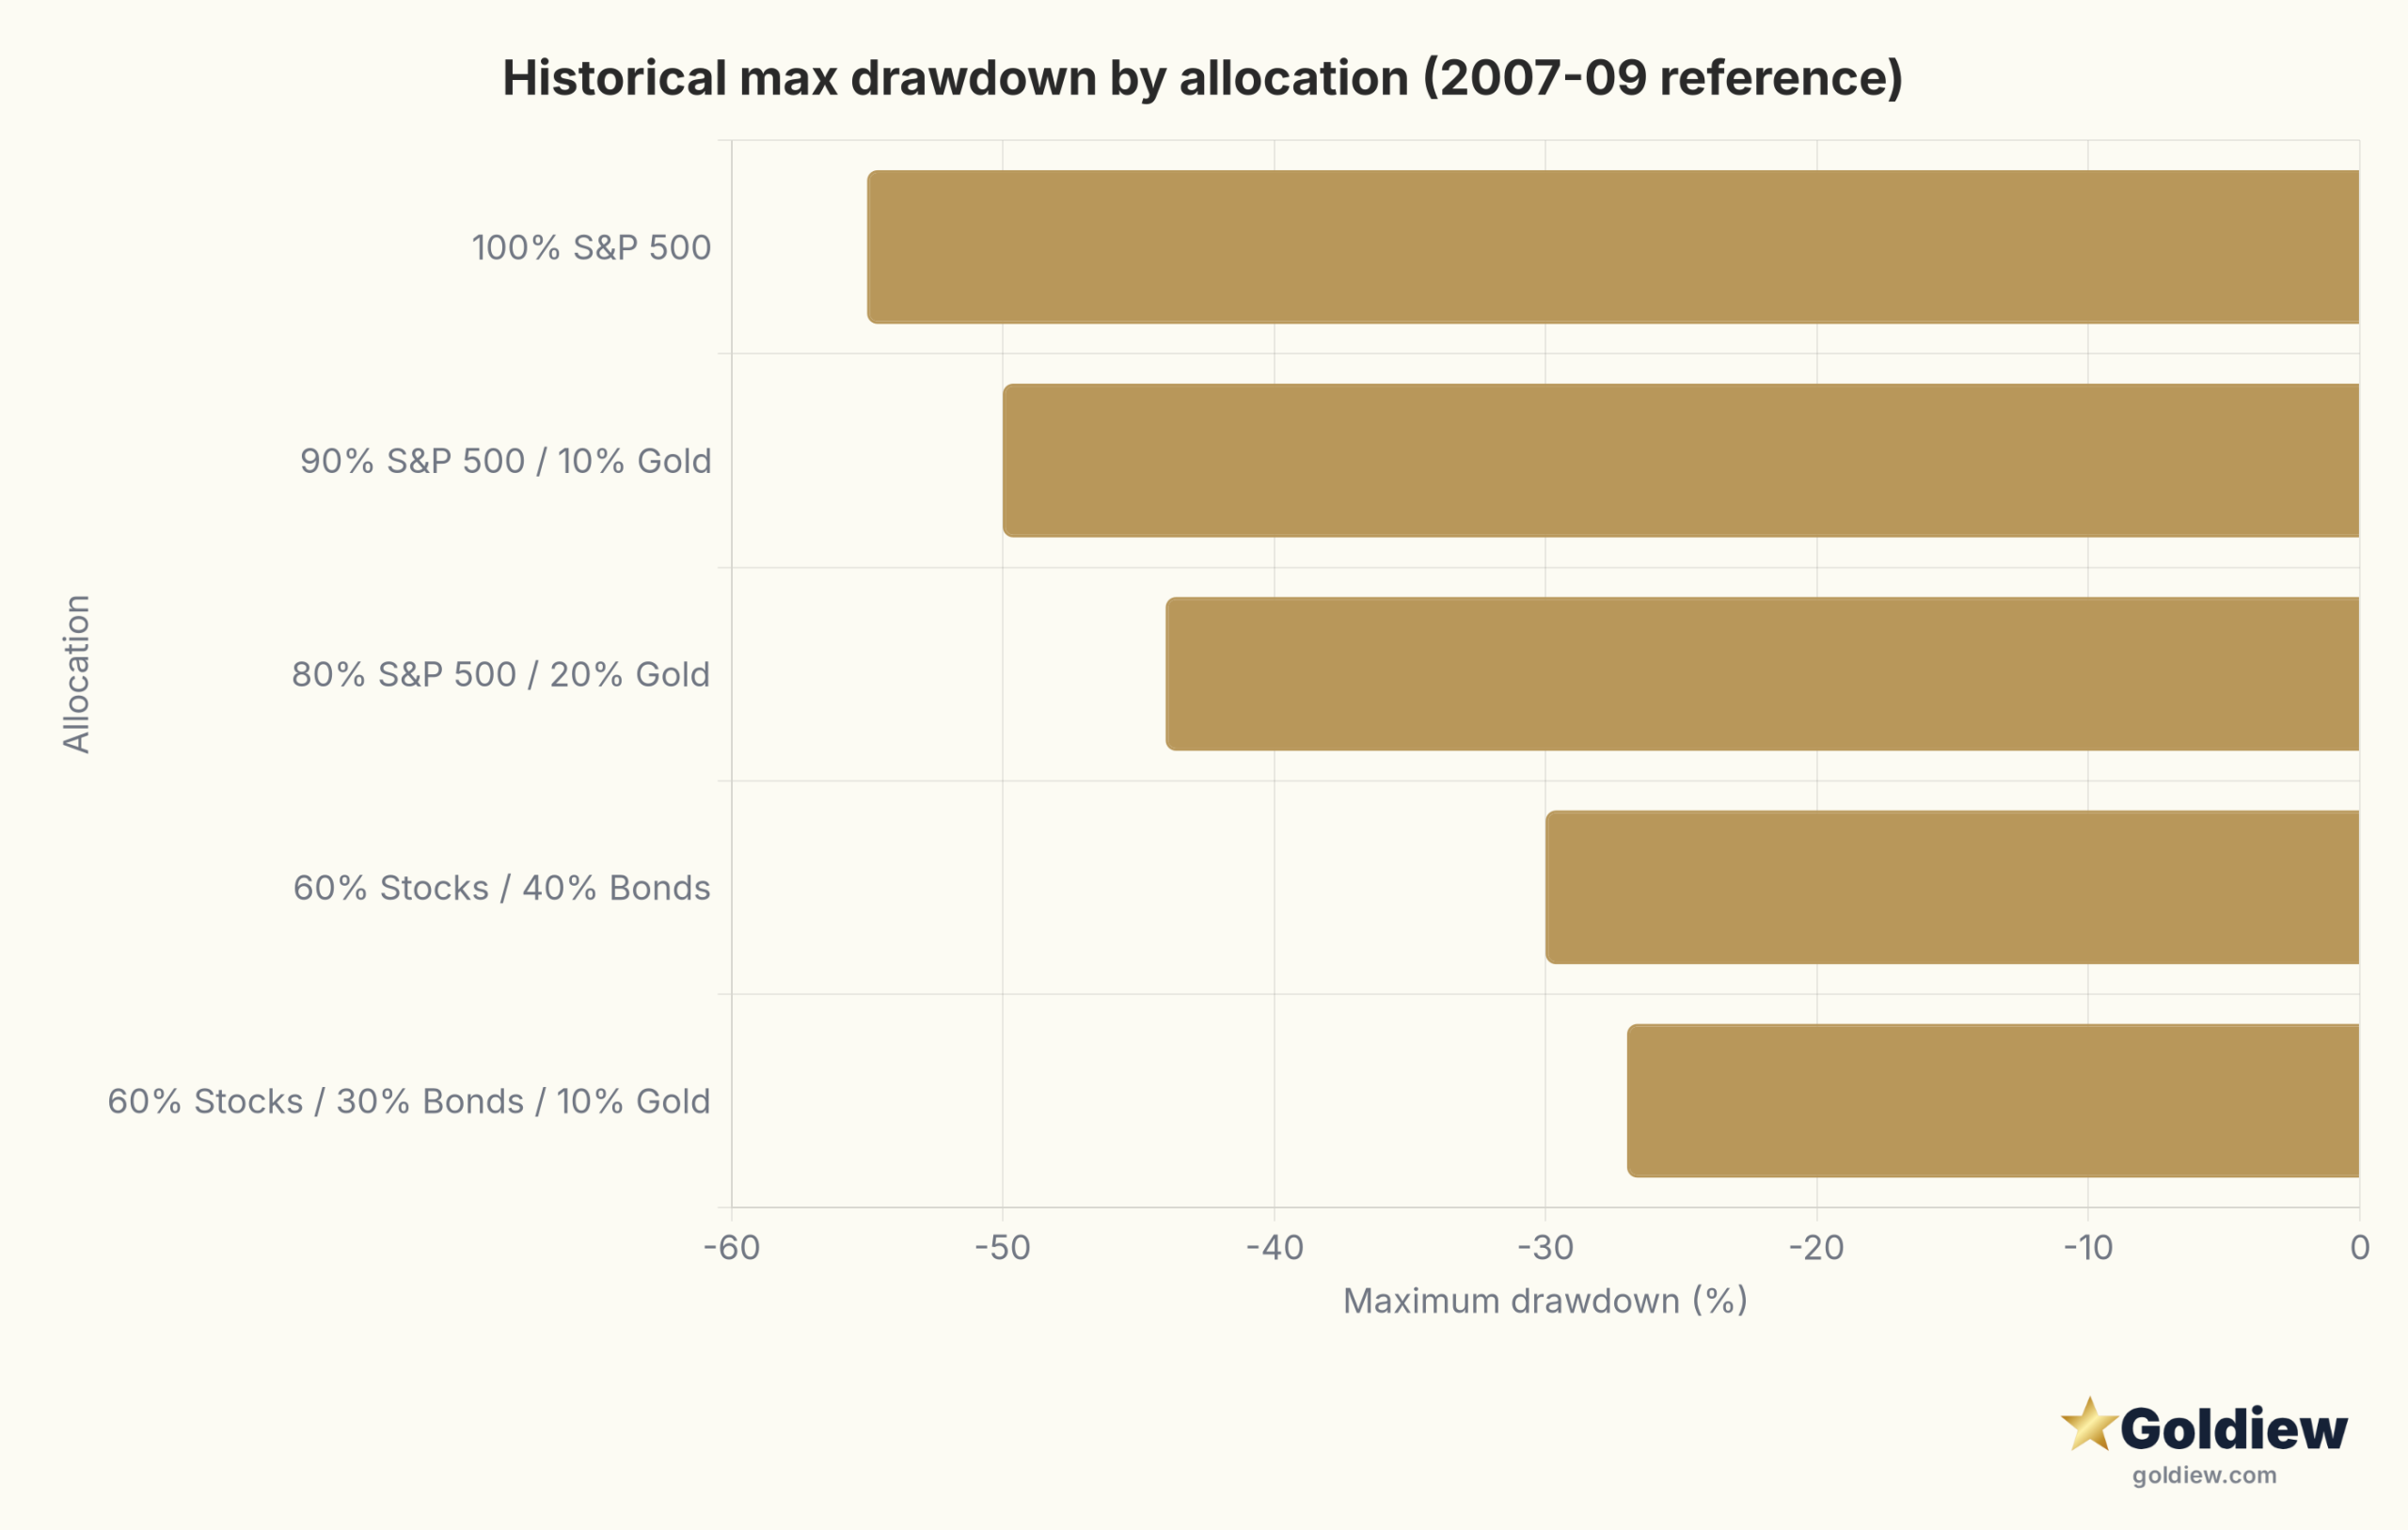
Visualizing the Tradeoff
| Portfolio Allocation | Approx. Annualized Real Return (historical) | Max Drawdown (historical worst) | Sharpe Ratio (approx.) |
|---|---|---|---|
| 100% S&P 500 | ~7.0% | -55% (2007-09) | 0.42 |
| 90% S&P 500 / 10% Gold | ~6.5% | -50% (2007-09) | 0.45 |
| 80% S&P 500 / 20% Gold | ~6.1% | -44% | 0.44 |
| 60% Stocks / 40% Bonds | ~5.5% | -30% | 0.49 |
| 60% Stocks / 30% Bonds / 10% Gold | ~5.5% | -27% | 0.51 |
Note: Approximate figures based on historical back-testing. Actual returns will vary. Sharpe ratios calculated using risk-free rates consistent with each historical period. Source: World Gold Council portfolio analysis, Ibbotson Associates data, S&P Dow Jones Indices.

Gold IRA vs. Regular Stock Market Account: Tax and Structural Differences
A gold IRA is a self-directed individual retirement account that holds physical gold (and other IRS-approved precious metals) instead of paper assets. The tax treatment differs significantly from a standard brokerage account, and from physical gold held directly. Mining stocks offer gold exposure without custodian requirements; the gold IRA vs gold mining stocks breakdown covers which structure fits a retirement portfolio better.
Under IRS Publication 590-A and Publication 590-B, traditional self-directed IRAs holding precious metals follow the same contribution, deduction, and distribution rules as standard traditional IRAs. This means:
- Contributions may be tax-deductible depending on income and whether you have a workplace plan (IRS Publication 590-A, 2024 edition)
- Growth inside the IRA is tax-deferred (you do not pay capital gains or income taxes annually on price appreciation)
- Distributions in retirement are taxed as ordinary income
- Required Minimum Distributions (RMDs) begin at age 73 under the SECURE 2.0 Act (signed December 2022)
By contrast, physical gold held outside an IRA is a capital asset subject to the collectibles tax rate of 28% on long-term gains (IRS Publication 544), compared to the standard long-term capital gains rate of 0-20% that applies to stocks held over one year. This is a meaningful structural disadvantage for holding gold directly versus inside an IRA wrapper. A gold ETF inside a standard IRA avoids the custodian layer; the gold IRA vs gold ETF comparison details the fee and ownership tradeoffs.
Key Structural Differences at a Glance
| Feature | Stock IRA (Traditional) | Gold IRA (Self-Directed) | Physical Gold (Direct) |
|---|---|---|---|
| Tax-deferred growth | Yes | Yes | No |
| Tax on gains | Ordinary income at withdrawal | Ordinary income at withdrawal | 28% collectibles rate (long-term) |
| Contribution limits (2024) | $7,000 / $8,000 if 50+ | Same ($7,000 / $8,000) | Unlimited |
| Annual storage fees | None | $100-$300/yr (IRS-approved depository) | Varies (home safe or private vault) |
| Custodian required | Yes (brokerage) | Yes (self-directed IRA custodian) | No |
| Home storage allowed | N/A | No (IRS prohibited transaction rules) | Yes |
| Eligible assets | Stocks, bonds, ETFs, mutual funds | IRS-approved gold/silver/platinum/palladium | Any physical metal |
The IRS requires that gold held in an IRA meet minimum fineness standards: 99.5% pure for gold bars and most gold coins. The American Gold Eagle coin is an IRS-approved exception that is slightly below 99.5% purity but explicitly permitted by statute. Gold must be stored with an IRS-approved custodian, not at home. Storing IRA gold at home constitutes a prohibited transaction under IRS Publication 590-B and could result in the entire IRA being distributed and taxed.
Who Should Consider Adding Gold to a Retirement Portfolio
The data above points to a specific profile of investor for whom gold exposure in a retirement portfolio may make sense. This is descriptive, not prescriptive. Your specific situation requires a licensed financial advisor.
- Within 10-15 years of retirement or already retired
- Existing retirement assets of $50,000 or more (gold IRA minimums are typically industry-reported around $10,000-$50,000)
- Currently concentrated heavily in equities with no non-correlated assets
- Concerned about sequence-of-returns risk (losing value in early retirement years)
- Has a long-term holding horizon of 10+ years for the gold position
- Early career investor with 25+ years until retirement (equities’ compounding advantage is maximum here)
- Retirement assets below $25,000 (fees are disproportionate at small account sizes)
- May need liquidity within 5 years (precious metals IRA distributions are less flexible than standard IRAs)
- Already holds significant non-equity assets (real estate, bonds) that partially serve the same diversification function
The “who is NOT a good candidate” category matters as much as the positive profile. Augusta Precious Metals, one of the more transparent gold IRA providers, explicitly states their typical client has at least $50,000 in eligible retirement assets. An investor with $15,000 total in a 401(k) would see fees consume a disproportionate share of the account’s value in a gold IRA structure.
Decision Framework: Gold IRA vs. Stocks vs. Both
The research does not support an all-or-nothing choice between stocks and gold. The question for most retirement investors is whether to add a small gold allocation on top of a primarily equity-based retirement portfolio.
- Time horizon 20+ years
- Can tolerate 30-55% drawdowns psychologically and financially
- Not drawing from the portfolio in the near term
- Low fee priority (simplest, lowest-cost option)
- Within 10-15 years of retirement or already in it
- Existing assets of $50,000+ to absorb gold IRA’s fixed fees
- Wants to reduce worst-case drawdown without fully exiting equities
- Long-term holder (not expecting to sell gold within 5 years)
- Very close to or in retirement, with low tolerance for any drawdown
- Already has a pension or guaranteed income source (Social Security, annuity) reducing equity-growth dependency
- Historical data suggests return drag becomes significant above 15-20% gold
- Consult a licensed financial advisor before exceeding 10% in any single commodity
This framework is a starting point, not a recommendation. The right allocation depends on your full financial picture: other assets, income sources, tax situation, timeline, and tolerance for volatility. A licensed financial advisor can model specific scenarios for your situation.
Frequently Asked Questions
Has gold ever beaten stocks over a full 50-year period?
Not over the 1975-2025 full period. Stocks (S&P 500 Total Return) have outperformed gold significantly when measured over the complete 50-year span, primarily because stocks compound via dividends while gold generates no income. However, over shorter 10-year windows, gold has outperformed stocks during the 1970s inflationary decade and the 2000-2009 “lost decade.” The length of the measurement period matters enormously.
What is the main tax advantage of holding gold inside an IRA instead of directly?
Physical gold held outside an IRA is taxed at the collectibles capital gains rate of 28% on long-term gains, per IRS Publication 544. Inside a traditional gold IRA, growth is tax-deferred and distributions are taxed as ordinary income (your marginal rate in retirement, which may be lower). This structural advantage can be significant over a multi-decade holding period. Consult your tax advisor for your specific situation.
Can I hold gold ETFs in a standard IRA instead of a physical gold IRA?
Yes. Gold ETFs such as SPDR Gold Shares (GLD) or iShares Gold Trust (IAU) can be held in a standard IRA at any major brokerage, which is simpler and typically lower cost than a physical gold IRA. The main difference is that ETF shares represent a claim on gold, not direct ownership of physical metal. Some investors prefer physical metal for different reasons. ETFs follow the same IRA contribution limits and tax treatment as other securities. Gold ETF gains inside an IRA are also taxed as ordinary income at distribution, avoiding the 28% collectibles rate that would apply outside an IRA.
What is the minimum investment for a gold IRA?
There is no statutory minimum set by the IRS, but gold IRA providers set their own minimums based on their fee structure. Industry-reported minimums for well-known providers: Augusta Precious Metals around $50,000, Noble Gold around $20,000, Birch Gold around $10,000. These figures are industry-reported and not always stated on provider home pages. Always confirm current terms directly with the provider during a consultation.
Does gold protect against inflation?
Gold’s relationship with inflation is more complicated than often presented. Over very long horizons (decades), gold has roughly preserved purchasing power. Over shorter and medium-term horizons, the correlation between gold price and CPI is inconsistent. In the 1970s, gold strongly outpaced inflation. In the 1980s and 1990s, gold lost value in real terms despite moderate inflation. In 2021-2022, gold was flat to down while inflation ran at 40-year highs. Whether gold belongs in your portfolio should not rest on the assumption that it reliably tracks inflation. Discuss this nuance with a licensed financial advisor.
What are the ongoing fees for a gold IRA?
A typical gold IRA incurs three fee layers: (1) account setup fee, usually $50-$150 one-time; (2) annual custodian fee, usually $80-$150/yr; (3) annual storage fee at an IRS-approved depository, usually $100-$175/yr. Some providers waive fees for qualifying account sizes or first-year promotions. Augusta Precious Metals, for example, offers a multi-year fee waiver for qualifying rollover accounts (current terms reviewed during consultation). At a $100,000 account, total annual fees of $200-$325 represent 0.20-0.33% annually, comparable to some actively managed mutual funds but higher than a low-cost S&P 500 index fund.
Can I roll my 401(k) into a gold IRA?
Yes, generally. If you have left your employer or the plan permits in-service withdrawals, you can roll a 401(k) directly into a self-directed IRA that holds precious metals. A direct rollover (trustee-to-trustee transfer) avoids the 20% withholding requirement and the 60-day rollover rule. Under IRS Publication 590-A, a direct rollover from a qualified plan to an IRA is not a taxable event. The gold IRA provider’s in-house IRA department typically handles the paperwork. Consult your tax advisor before initiating any rollover.
Is home storage of IRA gold legal?
No. Storing IRA-titled precious metals at home constitutes a prohibited transaction under IRS rules (Publication 590-B). The entire IRA would be treated as distributed in the year the prohibited transaction occurred, triggering full ordinary income tax plus potential 10% early distribution penalty if you are under 59.5. The FINRA has issued investor alerts warning about “home storage gold IRA” marketing as a misleading concept. Physical gold must be held by an IRS-approved depository.
What gold coins and bars are eligible for an IRA?
The IRS requires gold held in an IRA to meet minimum fineness of 99.5% (0.995) purity. Approved products include: American Gold Eagle coins (statutory exception despite slightly lower purity), American Gold Buffalo coins (99.99%), Canadian Maple Leaf coins, Australian Kangaroo/Nugget coins, and gold bars meeting the 99.5% purity standard produced by an approved refiner. Collectible or numismatic coins are generally not eligible. IRS Publication 590-B contains the statutory definition. Confirm eligible products with your custodian before purchasing.
Which is better for a long-term retirement portfolio: gold IRA or index fund IRA?
Historical data suggests an all-index-fund IRA generates higher long-run returns than an all-gold IRA. The case for a gold IRA is as a partial allocation within a larger portfolio, not as a replacement for equities. A blended approach (5-10% gold, 90-95% equities or diversified index funds) has historically improved risk-adjusted returns by reducing worst-case drawdowns at the cost of slightly lower absolute returns. Neither choice is universally “better.” The answer depends on your time horizon, existing assets, income needs, and risk tolerance. Consult a licensed financial advisor before making allocation decisions.
Sources and Methodology
This guide draws on publicly available historical return data, IRS publications, and independent institutional research. Partner company facts sourced from company public websites as verified 2026.
- IRS Publication 590-A, Contributions to Individual Retirement Arrangements (IRAs), 2024 edition
- IRS Publication 590-B, Distributions from Individual Retirement Arrangements (IRAs), 2024 edition
- IRS Publication 544, Sales and Other Dispositions of Assets (collectibles tax rate)
- FINRA Investor Alert: Precious Metals Fraud Warning Signs
- FINRA Investor Alerts: Investor Education
- SEC Investor.gov: Understanding Investment Products and Asset Classes
- World Gold Council, “Gold as a Strategic Asset” (2024 update). Data on long-run returns and correlation analysis. Published at gold.org.
- Ibbotson Associates (now Morningstar), historical asset class return data. Referenced via World Gold Council’s portfolio analysis publications.
- S&P Dow Jones Indices, S&P 500 Total Return Index historical data. Available at spglobal.com/spdji.
- SECURE 2.0 Act of 2022 (P.L. 117-328), Division T: RMD age increase to 73 effective 2023.
- Augusta Precious Metals public website: founding year, awards, process description, BBB rating. verified 2026.
- Birch Gold Group public website: founding year, customer count, endorsers. verified 2026.
- Noble Gold Investments public website: customer count, wealth safeguarded, depository. verified 2026.