
Central banks have been buying gold at a historically elevated pace for three consecutive years. Between 2022 and 2024, official-sector net purchases stayed above 1,000 tonnes each year, roughly double the annual average of the 2010s. This guide reconstructs the numbers using two public sources, the World Gold Council central bank statistics and the IMF International Financial Statistics, explains the methodology behind them, and closes with an honest read of what this trend does and does not tell an individual investor.
Quick answer
Central bank net purchases have exceeded 1,000 tonnes for three years running through 2024, led by Poland, Turkey, and India
The World Gold Council reports central bank net purchases of 1,136 tonnes in 2022, 1,050.8 tonnes in 2023, and 1,044.6 tonnes in 2024. Poland (90t), Turkey (75t), and India (73t) topped the 2024 disclosed rankings. Much of the total is not directly reported to the IMF: WGC estimates that IMF International Financial Statistics captured only 34% of official-sector demand in 2024. For an individual investor, this trend is macro context, not a personal buy signal, and should be discussed with a licensed advisor before it changes any allocation.
What “central bank gold buying” actually means
Two organizations publish the numbers most researchers cite. Reading them correctly starts with knowing what each one measures.
The International Monetary Fund publishes monthly gold holdings for participating countries through its International Financial Statistics dataset. Countries report their reserves under the Special Data Dissemination Standard on a defined schedule. IMF data reflects only what member central banks officially disclose. As the World Gold Council notes on its own dashboard, IFS data typically runs about two months in arrears.
The World Gold Council publishes a broader estimate. Its quarterly Gold Demand Trends report and its central bank dashboard combine three inputs: the IMF disclosures above, direct reports from central banks and market participants, and an estimate for unreported purchases inferred from trade data, refinery flows, and market intelligence. The WGC number is always higher than the IMF number because it includes buying that has not yet been officially declared, and buying that may never be publicly attributed to a specific country.
For 2024, the World Gold Council states that IMF IFS data reflects only 34% of its total official-sector demand estimate. That single ratio is the clearest evidence of how much central bank gold activity happens outside the formal reporting stream, and it is the reason the two data sources rarely match.
The recent buying wave, year by year
Central bank demand shifted decisively upward after 2021. The 2022 total of 1,136 tonnes was a multi-decade high. The two years that followed came in below 2022 but stayed well above the 400 to 500 tonnes per year that had been typical through the 2010s. Gold spot price history from 1996 to 2026 shows how prices shifted as central bank demand moved into record territory.


| Year | Central bank net purchases (tonnes) | Notes from the WGC report |
|---|---|---|
| 2022 | 1,136 | Multi-decade high. WGC noted a “second consecutive quarter of huge demand” and stated the “majority of which was unreported.” |
| 2023 | 1,050.8 | Second-highest annual total on record at time of publication. |
| 2024 | 1,044.6 | Third consecutive year above 1,000t. WGC reported that Q4 alone was 333t, described as an acceleration. |
The Q4 2024 figure of 333 tonnes is a useful anchor for anyone following month-by-month reporting. Central bank activity is uneven across quarters; a single quarter can move the annual read by 20% or more. Annual totals are the more stable comparison.
Which central banks led the buying in 2024
Among central banks that publicly reported their transactions in 2024, six names stood out. All six were emerging or frontier-market central banks. G7 central banks were largely inactive.

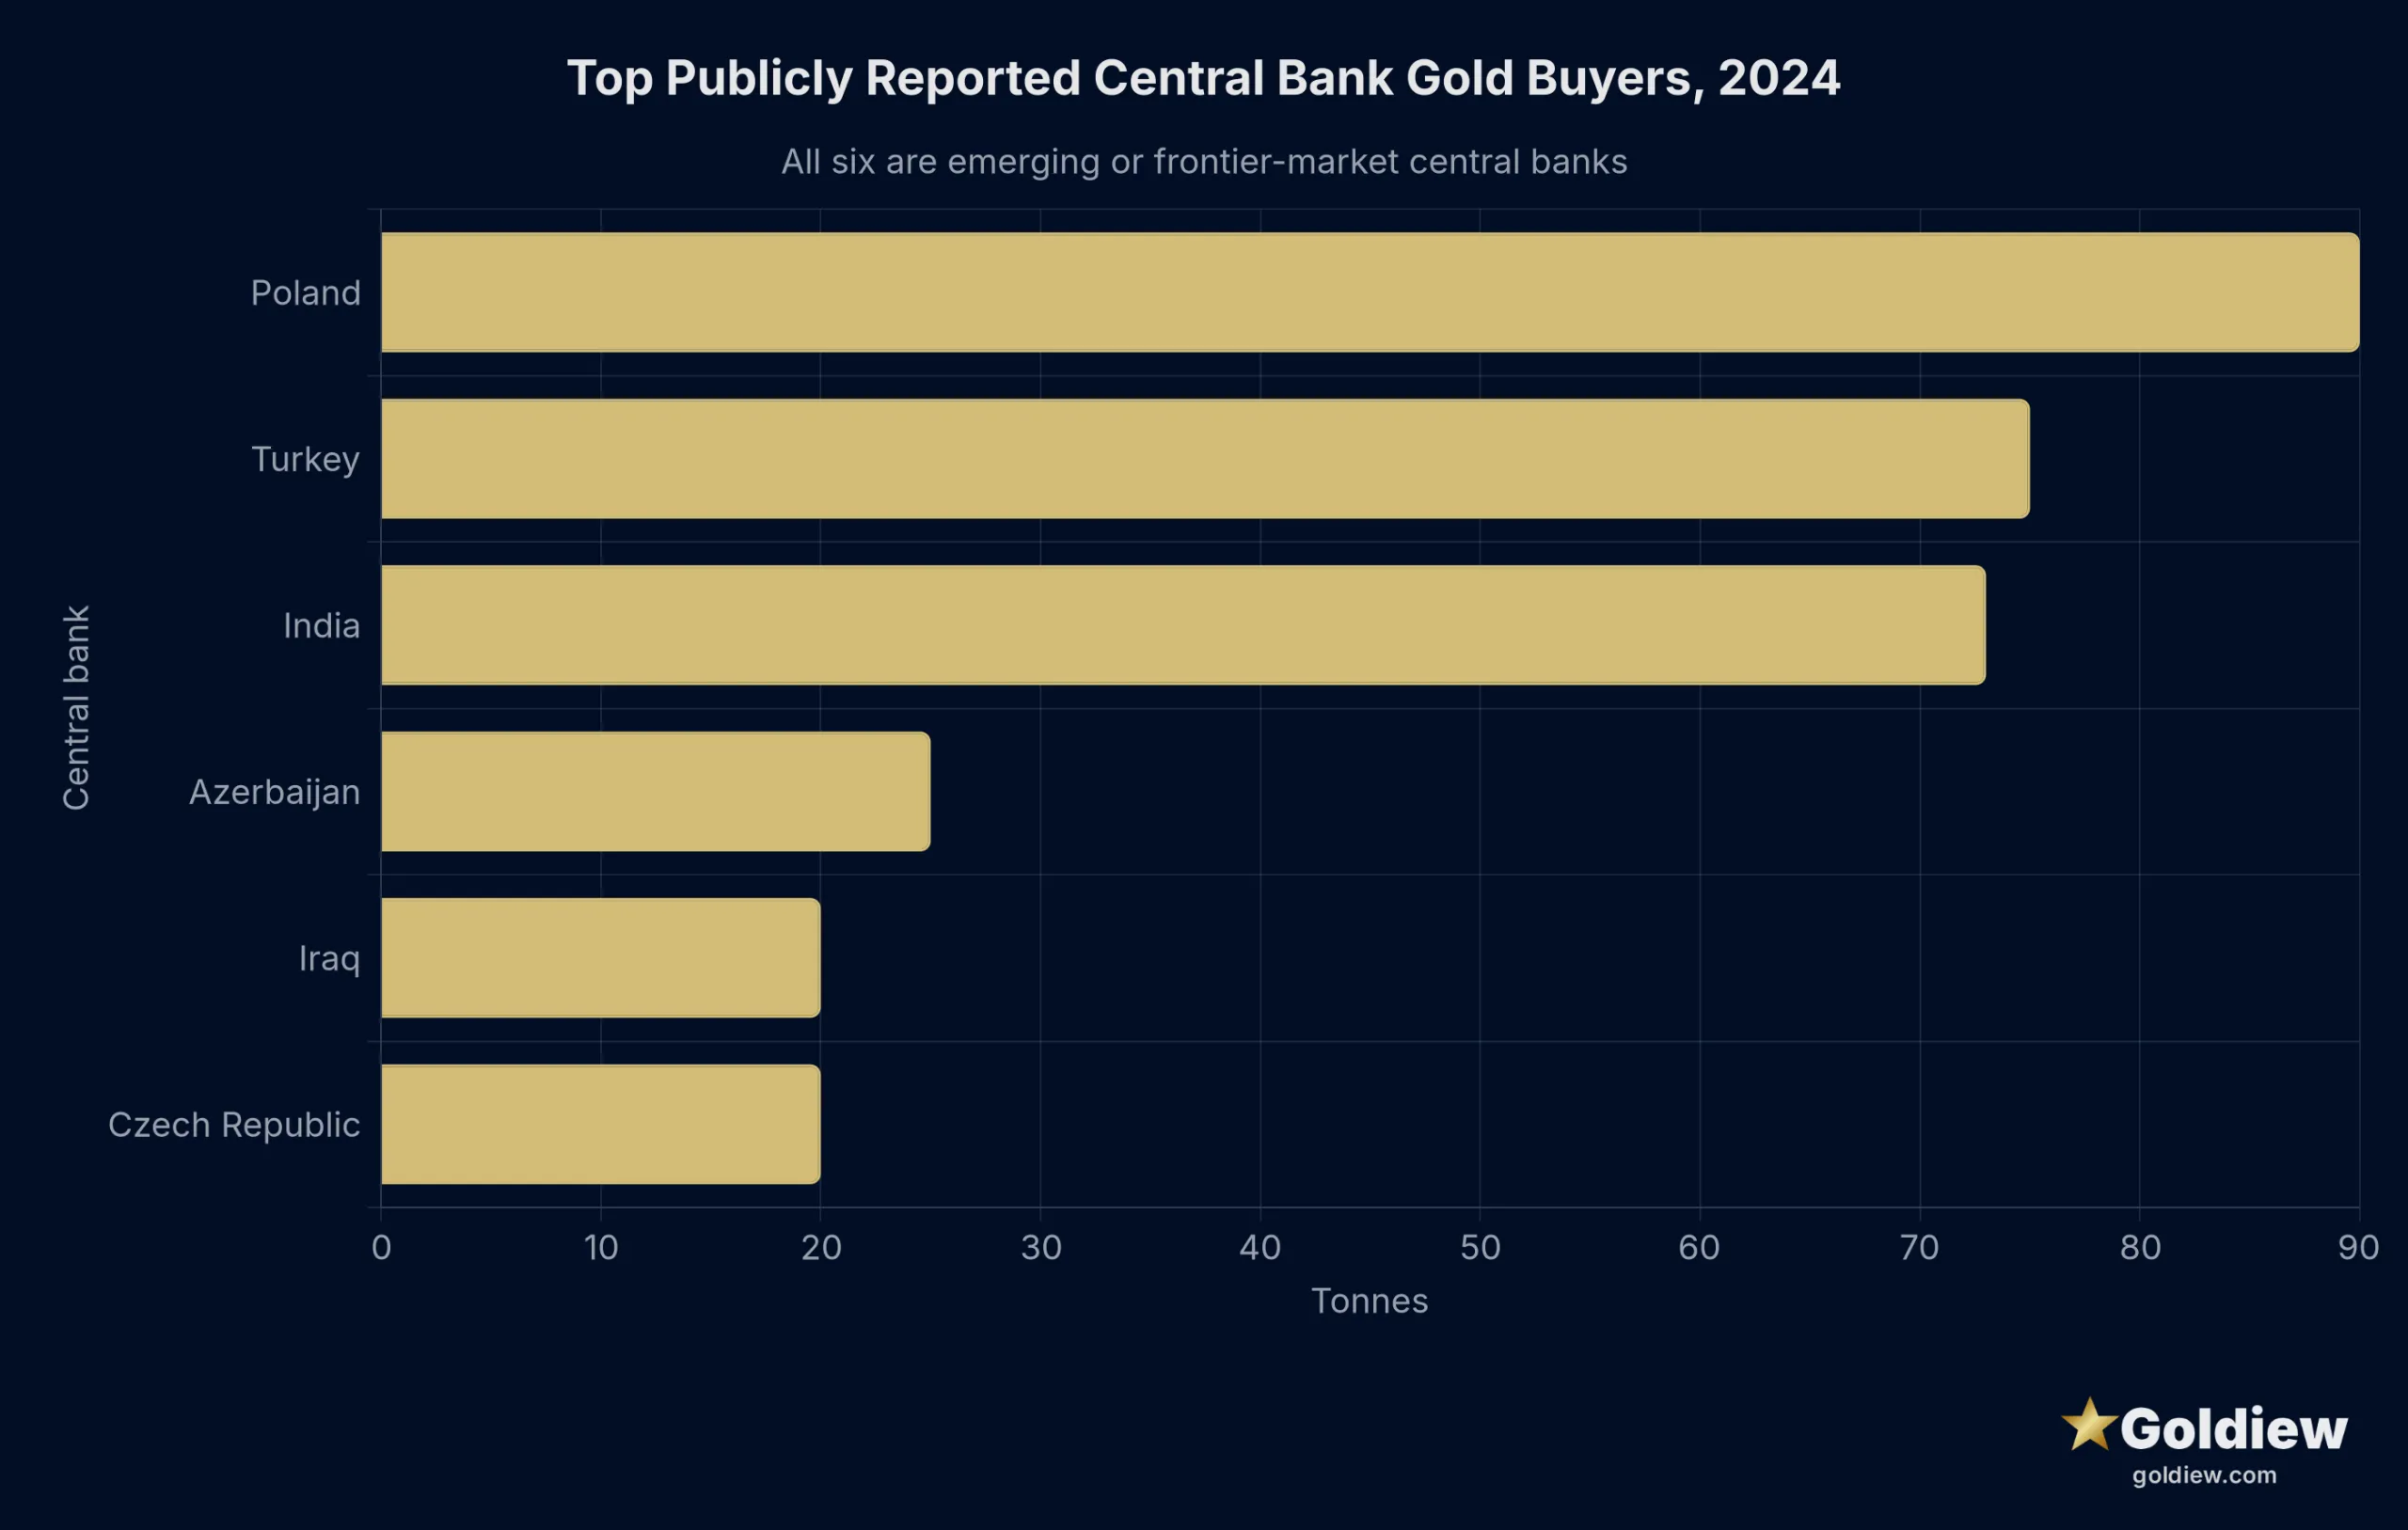
| Central bank | 2024 net purchases (tonnes, reported) |
|---|---|
| Poland (Narodowy Bank Polski) | 90 |
| Turkey (Central Bank of the Republic of Turkey) | 75 |
| India (Reserve Bank of India) | 73 |
| Azerbaijan (Central Bank of Azerbaijan) | 25 |
| Iraq (Central Bank of Iraq) | 20 |
| Czech Republic (Czech National Bank) | 20 |
Two points about this table are worth stating plainly. First, these are only publicly reported flows. The People’s Bank of China reported additions to its official reserves over several months of 2024, but WGC estimates suggest actual Chinese official-sector activity is materially larger than disclosed totals imply. Second, the ranking rotates from year to year. In 2023, the top disclosed positions belonged to different central banks, with Poland, China, and Singapore among the highest reported buyers depending on the reporting month.
Poland has been the most consistent large buyer in the recent cycle. Its central bank has publicly stated a target of holding roughly 20% of its reserves in gold and has been steadily adding to holdings for several years. Turkey has bought and sold in cycles, tied in part to domestic gold market dynamics and periodic sales to meet domestic demand. India has resumed regular monthly additions after a decade of holding steady.
Central banks that sold gold in 2024
Not every central bank was a net buyer. Three publicly reported net sales for 2024.
| Central bank | 2024 net sales (tonnes, reported) |
|---|---|
| Philippines (Bangko Sentral ng Pilipinas) | 30 |
| Kazakhstan (National Bank of Kazakhstan) | 10 (net decline) |
| Singapore (Monetary Authority of Singapore) | 10 |
Central bank sales are not a warning signal in themselves. Kazakhstan is one of the world’s largest gold producers and periodically monetizes domestic output. The Philippines has historically alternated between buying and selling based on its overall reserve management framework. Singapore added materially to gold in 2023 and trimmed in 2024, consistent with a portfolio rebalancing rather than a directional call.
Gold’s share of official reserves varies enormously by country
The other data cut that matters is how much gold each country holds relative to its total foreign reserves. The Western advanced economies inherited very large gold positions from the pre-1971 monetary system. The United States, Germany, France, and Italy each hold more than 60% of their reported foreign reserves in gold, according to figures published on the World Gold Council’s central bank dashboard. Most emerging-market central banks hold well under 10%.
The IMF also holds a large gold position, third largest in the world after the United States and Germany, and reports its holdings separately.
This gap explains most of the recent buying pattern. Central banks with a low gold share and expanding balance sheets have been the persistent buyers. Central banks that already hold a high gold share have had little reason to add. The direction of travel points toward a slow convergence, but at the current pace it would take decades for emerging-market gold shares to approach the levels held by the traditional reserve currencies. The WGC Central Bank Gold Reserves Survey, conducted annually, provides the qualitative context: a large share of surveyed central banks report that they expect global gold reserves to keep rising over the next twelve months, though survey responses are opinions, not commitments.
Methodology and data limitations
Anyone citing these numbers should also state their limits. Four issues are important.
Reporting lag. Central banks disclose gold changes on their own schedules. Some report monthly, some quarterly, some with a delay of several months. The IMF IFS series is a running compilation, updated as members report, and the World Gold Council notes that IFS data are typically two months in arrears.
Unreported buying. A meaningful share of official-sector gold activity is not attributed to a named country in the public data. Historically, this category has been dominated by the People’s Bank of China and by several Middle Eastern reserve holders that manage gold outside the standard reporting frame. The World Gold Council estimates this unreported component using trade data, refinery flows, and market intelligence.
Definitions of reserves. Some sovereign wealth funds and state-owned entities hold gold that is not classified as official reserves. The line between “central bank” and “sovereign entity” varies by country. Comparing across countries requires reading the specific footnotes.
Revisions. Historical numbers get revised as central banks issue late reports or corrections. Numbers reported in a given quarter’s Gold Demand Trends can differ from the same period cited in a later release. Always use the most recent WGC publication for point-in-time comparisons.
For a rigorous comparison of the physical flows underlying gold demand and supply, see the related guide on gold supply and demand data, and for the historical backdrop that helps explain why Western central banks still hold such large gold reserves, see the Bretton Woods system and 1971 gold-dollar break.
Why central banks have been buying more recently
The World Gold Council’s annual reserve manager survey asks central banks to rank the reasons behind their gold holdings. In recent editions, the most frequently cited motivations were long-term store of value, portfolio diversification (in the reserve-management sense used by central banks, not in the retail investment sense), and no counterparty risk. Reserve managers do not report their decisions as market timing calls. Their framing is structural: gold is a reserve asset that carries no credit risk and has been an official reserve for centuries.
Two additional factors are frequently discussed in reserve-manager commentary, though they should be read as context rather than prediction. First, sanctions imposed on Russian foreign reserves in 2022 highlighted the counterparty risk embedded in holding another country’s currency-denominated assets. Second, the multi-year trend toward reserve diversification away from a single-currency benchmark is documented in the IMF Currency Composition of Official Foreign Exchange Reserves data series. What that reserve shift means for retirement savings is the subject of the BRICS de-dollarization and gold IRA guide.
Neither of these factors constitutes a forecast of gold prices. Nobody can accurately predict where prices will go in the future.
What this means for an individual investor
Central bank gold buying is a macro data point. It is not a signal to buy or sell any specific asset in a personal portfolio. Three points are worth stating honestly.
Central banks operate on horizons of decades, not years. Their gold decisions are structural, tied to reserve composition, national accounts, and geopolitical positioning. An individual retirement horizon is different in kind. A central bank does not need to fund living expenses in eight years. The guide on why China and Russia are buying gold traces that geopolitical positioning to its IRA implications.
Correlation is not causation. Elevated central bank buying and elevated gold prices have overlapped in recent years, but attributing price moves to one factor is speculative. Physical demand from central banks, jewelry demand from India and China, investment demand through ETFs, and mine supply all interact. Past performance is not a guarantee of future results.
Any allocation decision belongs with a licensed advisor. If gold or precious metals fit inside a retirement account, the vehicle is a self-directed IRA held with an IRS-approved custodian. The mechanics, tax treatment, and eligibility rules for those accounts are governed by IRS Publication 590-A and Publication 590-B. Consult your tax advisor for your specific situation.
Frequently asked questions
How much gold did central banks buy last year?
The World Gold Council reported central bank net purchases of 1,044.6 tonnes for full-year 2024. That was the third consecutive year above 1,000 tonnes, following 1,136 tonnes in 2022 and 1,050.8 tonnes in 2023. Quarterly figures within the year varied widely; Q4 2024 alone accounted for 333 tonnes.
Which central banks buy the most gold?
Among publicly reported flows in 2024, the top buyers were Poland (90 tonnes), Turkey (75 tonnes), and India (73 tonnes), followed by Azerbaijan, Iraq, and the Czech Republic at 25, 20, and 20 tonnes respectively. Rankings rotate year to year. Chinese activity is significant but a portion is not attributed to a named country in the public data.
Why do World Gold Council and IMF numbers differ?
The IMF publishes only what central banks officially report through the International Financial Statistics dataset. The World Gold Council combines those disclosures with an estimate for unreported buying, drawing on trade data, refinery flows, and direct market intelligence. WGC has stated that IMF IFS data reflected only 34% of its total official-sector demand estimate for 2024. That gap is the estimated unreported component.
What share of central bank reserves is held in gold?
The share varies enormously by country. The United States, Germany, France, and Italy each hold more than 60% of their reported foreign reserves in gold, according to World Gold Council central bank statistics. Most emerging-market central banks hold well below 10%. The gap reflects the historical legacy of the pre-1971 monetary system, when Western economies accumulated the reserves they still hold today.
Did any central banks sell gold in 2024?
Yes. The Philippines reported 30 tonnes of net sales in 2024. Kazakhstan and Singapore each posted about 10 tonnes of net decline. Central bank sales are typically portfolio management or, in the case of gold-producing countries, monetization of domestic output. They are not usually a directional call on gold prices.
Is central bank buying a good reason for individuals to buy gold?
Central bank buying is a macro context signal, not a personal buy signal. Central banks operate on decade-plus horizons and have reserve-management mandates that differ fundamentally from an individual retirement portfolio. Any decision about adding gold to a personal portfolio should be discussed with a licensed advisor who understands the individual’s tax situation, income needs, and time horizon. Consult your tax advisor for the specifics of your case.
Where can I check the current data myself?
Two public sources cover most of what is publicly available. The World Gold Council publishes quarterly Gold Demand Trends reports and maintains a central bank dashboard on gold.org. The IMF publishes the International Financial Statistics dataset with monthly official reserve figures by country. Both are free to browse; the WGC dashboard requires a free account for full data downloads.
Sources and methodology
All tonnage figures on this page are drawn from the following public sources. Data as of publication reflects the most recent full-year totals available (2024) and quarterly figures through Q4 2024, per the World Gold Council. Central bank reserve figures reflect World Gold Council dashboard data with reporting lags of approximately two months per IMF IFS conventions.
- World Gold Council, Gold Demand Trends: Full Year 2024, published January 2025. gold.org/goldhub/research/gold-demand-trends
- World Gold Council, Gold Demand Trends: Full Year 2022, published January 2023. Central bank annual total: 1,136 tonnes.
- World Gold Council central bank statistics dashboard. gold.org/goldhub/data/gold-demand-by-central-banks
- World Gold Council, Gold Reserves by Country (central bank holdings and gold share of reserves). gold.org/goldhub/data/gold-reserves-by-country
- World Gold Council, Central Bank Gold Reserves Survey (annual reserve-manager survey). gold.org/goldhub/research/central-bank-gold-reserves-survey
- International Monetary Fund, International Financial Statistics, official reserve assets series. data.imf.org
- IMF, Currency Composition of Official Foreign Exchange Reserves (COFER), currency composition of allocated reserves. data.imf.org COFER
- IRS Publication 590-A, Contributions to Individual Retirement Arrangements (IRAs). irs.gov/publications/p590a
- IRS Publication 590-B, Distributions from Individual Retirement Arrangements (IRAs). irs.gov/publications/p590b
Methodology. This page reports figures verified against the World Gold Council central bank dashboard and IMF IFS references at time of publication. Tonnages are quoted verbatim from World Gold Council Gold Demand Trends releases where possible. Where a figure could not be independently verified against a primary source, it is described qualitatively rather than quantified. Historical tonnages get revised as central banks issue late reports; readers looking for the current point-in-time figure should consult the most recent WGC quarterly publication.